The Hogzilla’s outputs can be seen in GrayLog. By this architecture, the GrayLog’s features such as dashboards, graphs and searches are available.
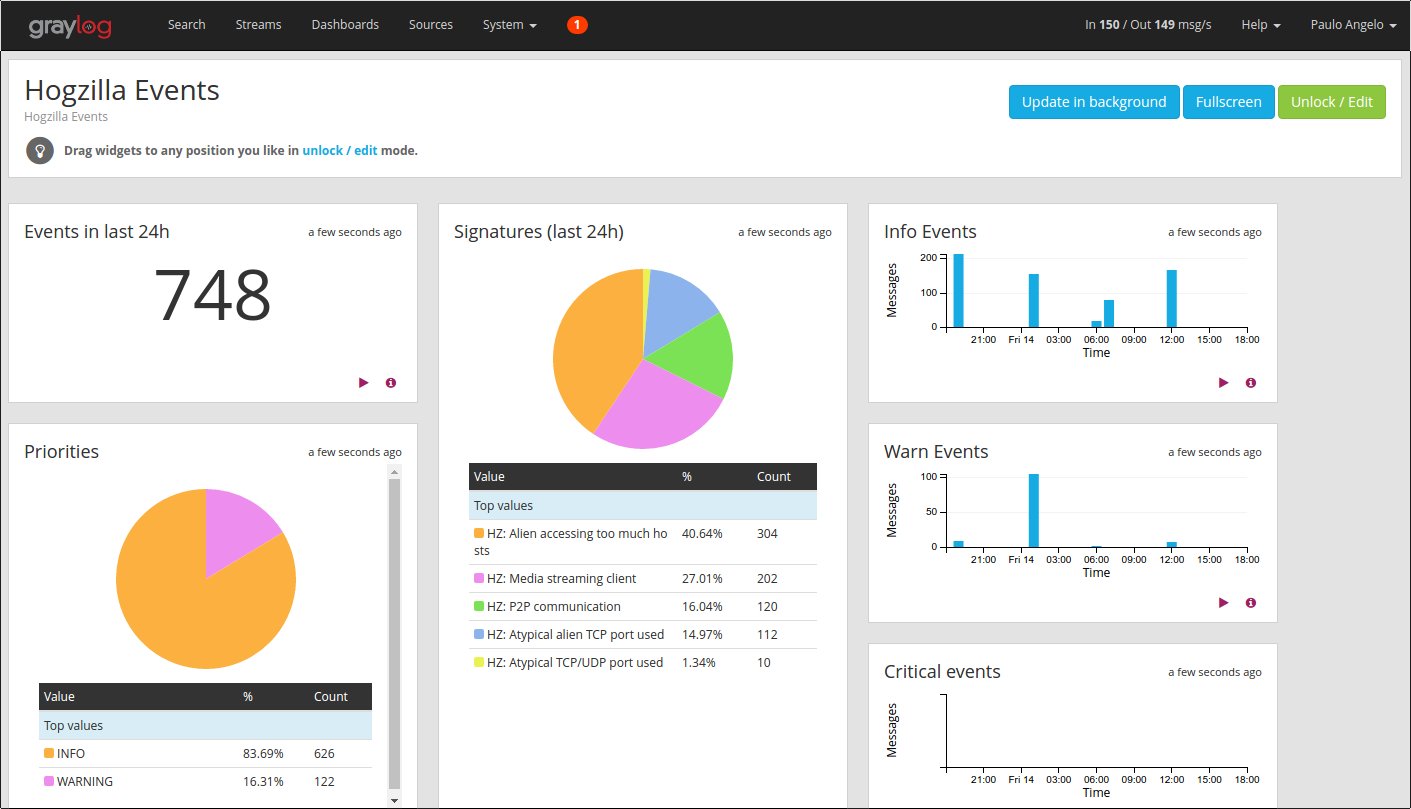
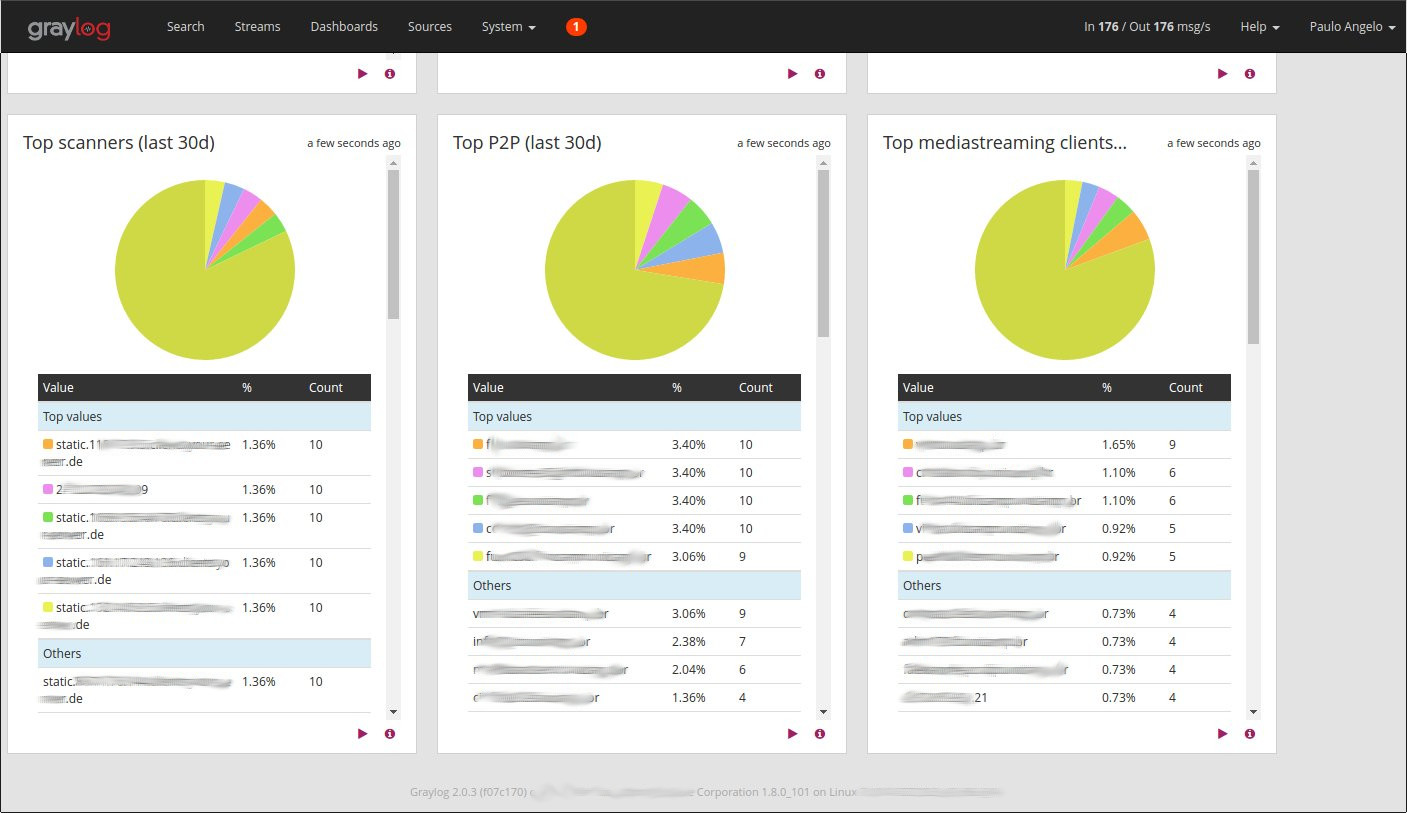
Below there are some screenshots, which illustrate what can be done.
1. Event Dashboard
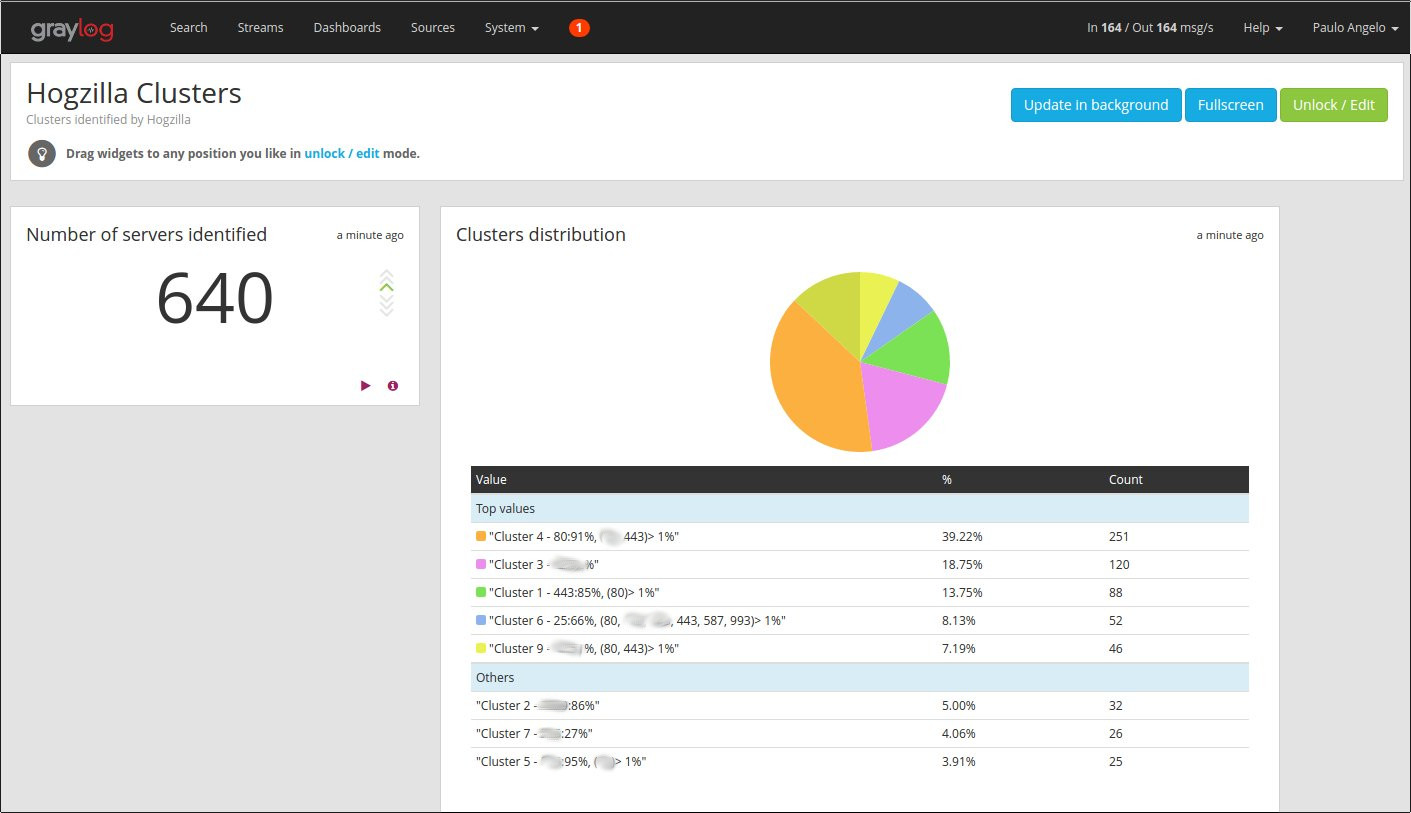
2. Visualization of automatically generated server groups
E.g. Servers in “Cluster 4”, “usually” receive 91% of incoming connections in port 80. We can assume that this group refers to the Web Servers. The grouping process is dynamic and it is updated every 6h.
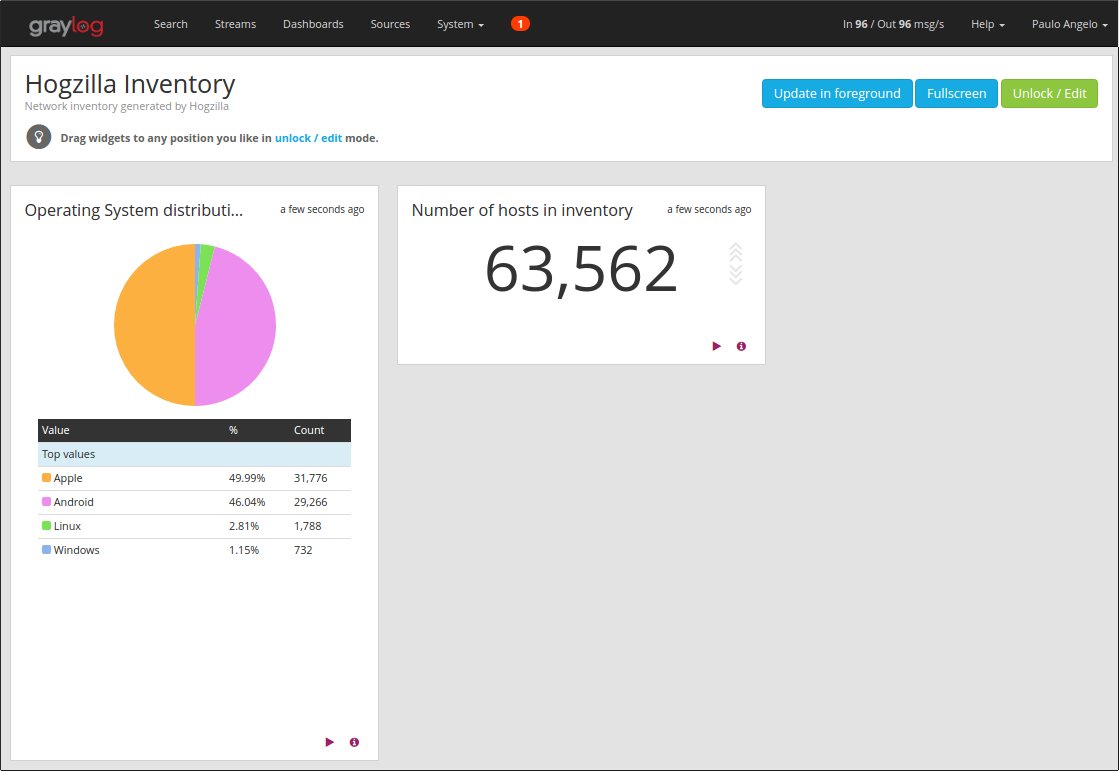
3. Visualization of an Operating System inventory, generated automatically
To create this inventory, Hogzilla uses information available in sFlows.
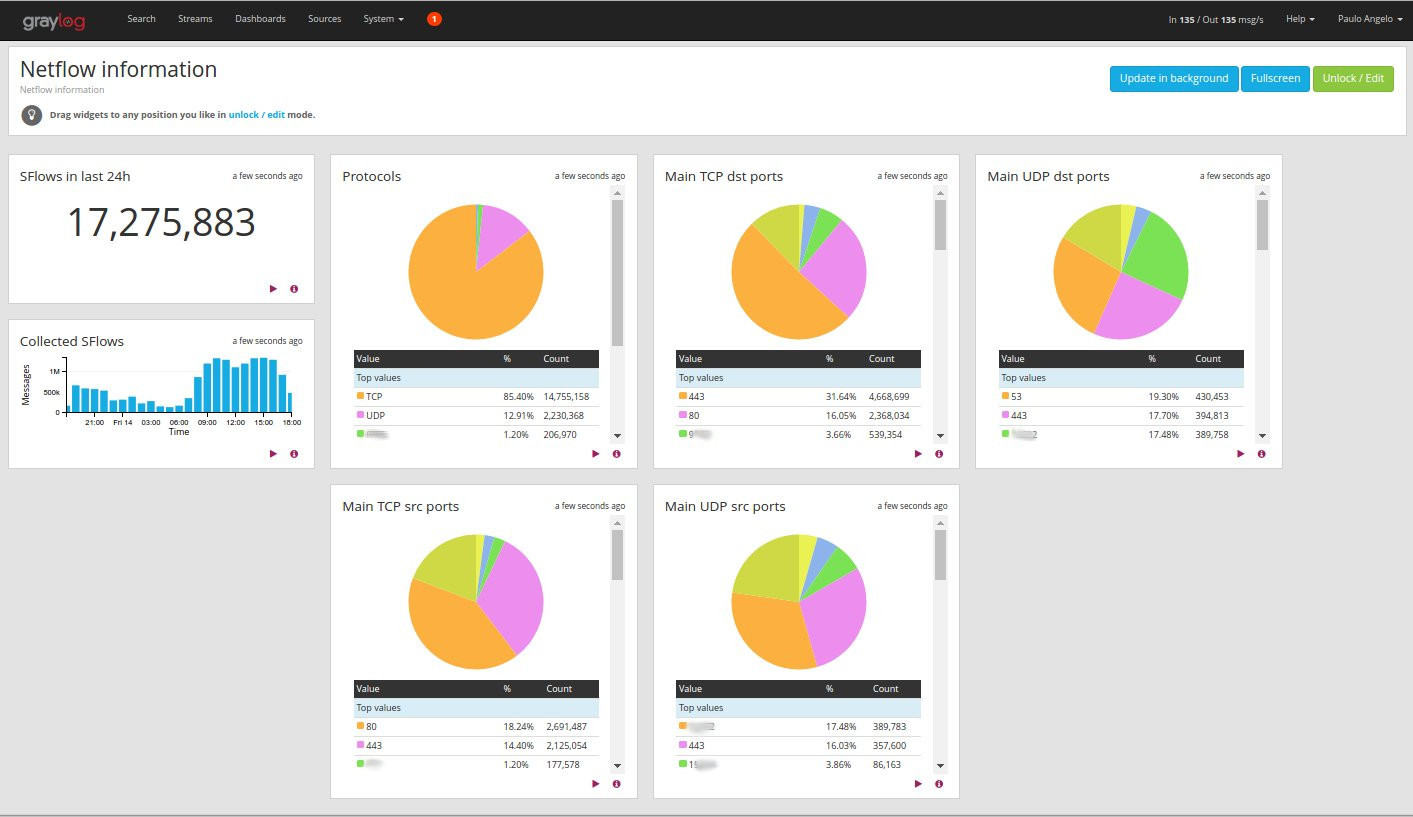
4. Dashboard to visualize basic information available in sFlows.
It is possible to also send sFlows directly to GrayLog and keep them for future searches. Image below illustrates a dashboard using this information, which enables a low cost network visibility.
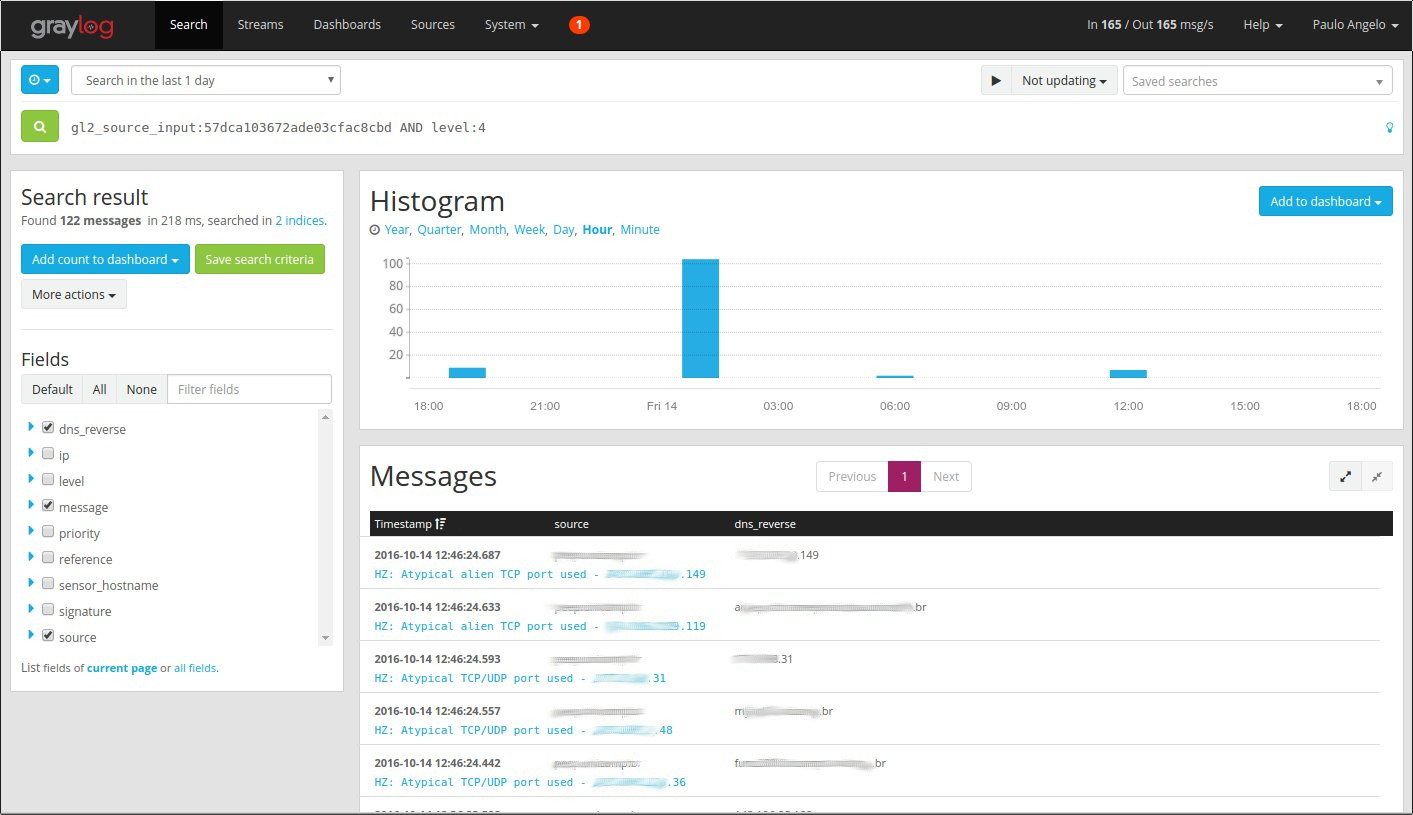
5. List of some Hogzilla IDS events
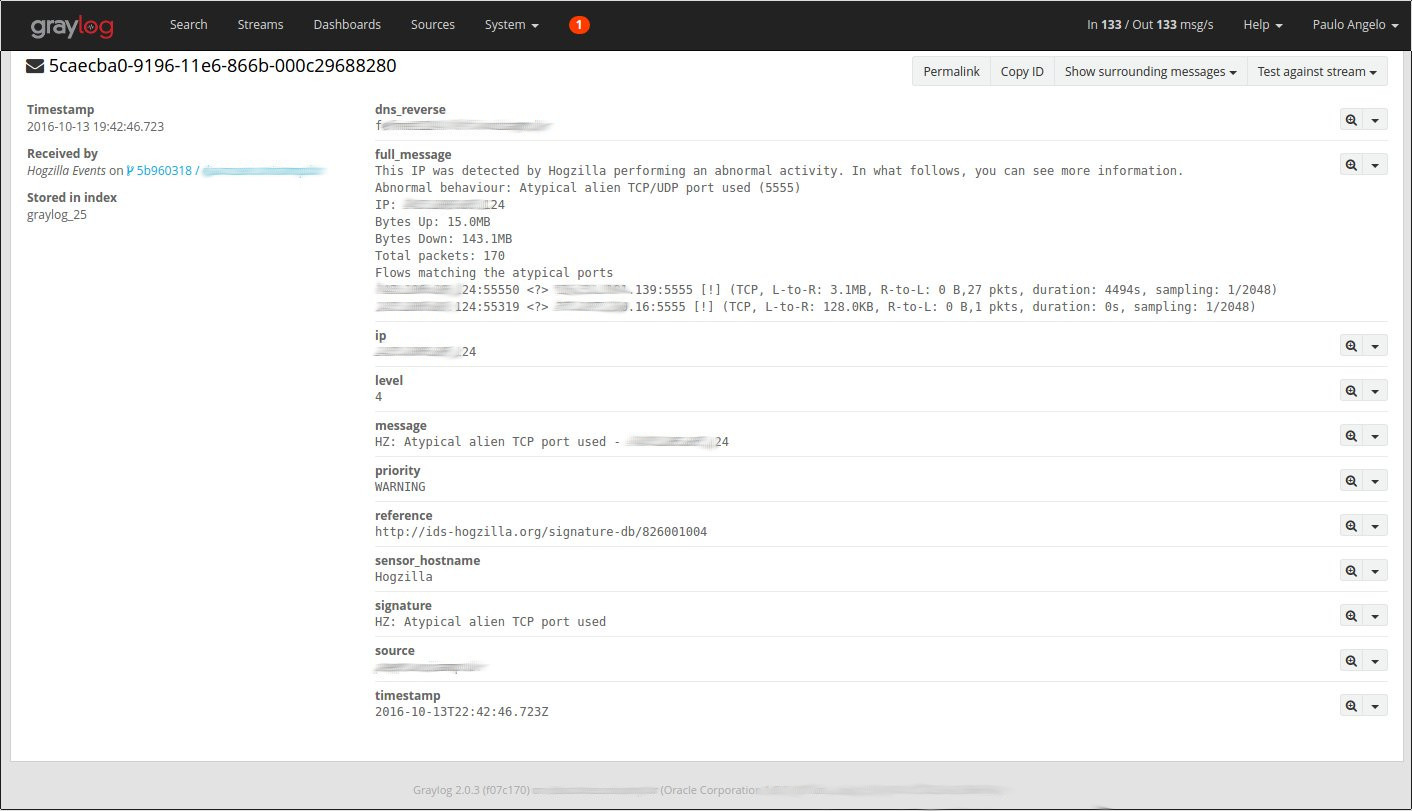
6. Details about a specific Hogzilla IDS event
Hogzilla provides details about the flows considered in the respective event. A proper notation is used:
- “<?>” means that the flow direction could not be determined
- ”=>” and “<=” indicates the flow direction (when it is possible)
- “[!]” means that the connection occurred (ie, it is not just a packet in a scan)
- “L-to-R” and “R-to-L” means “Left to Right” and “Right to Left”
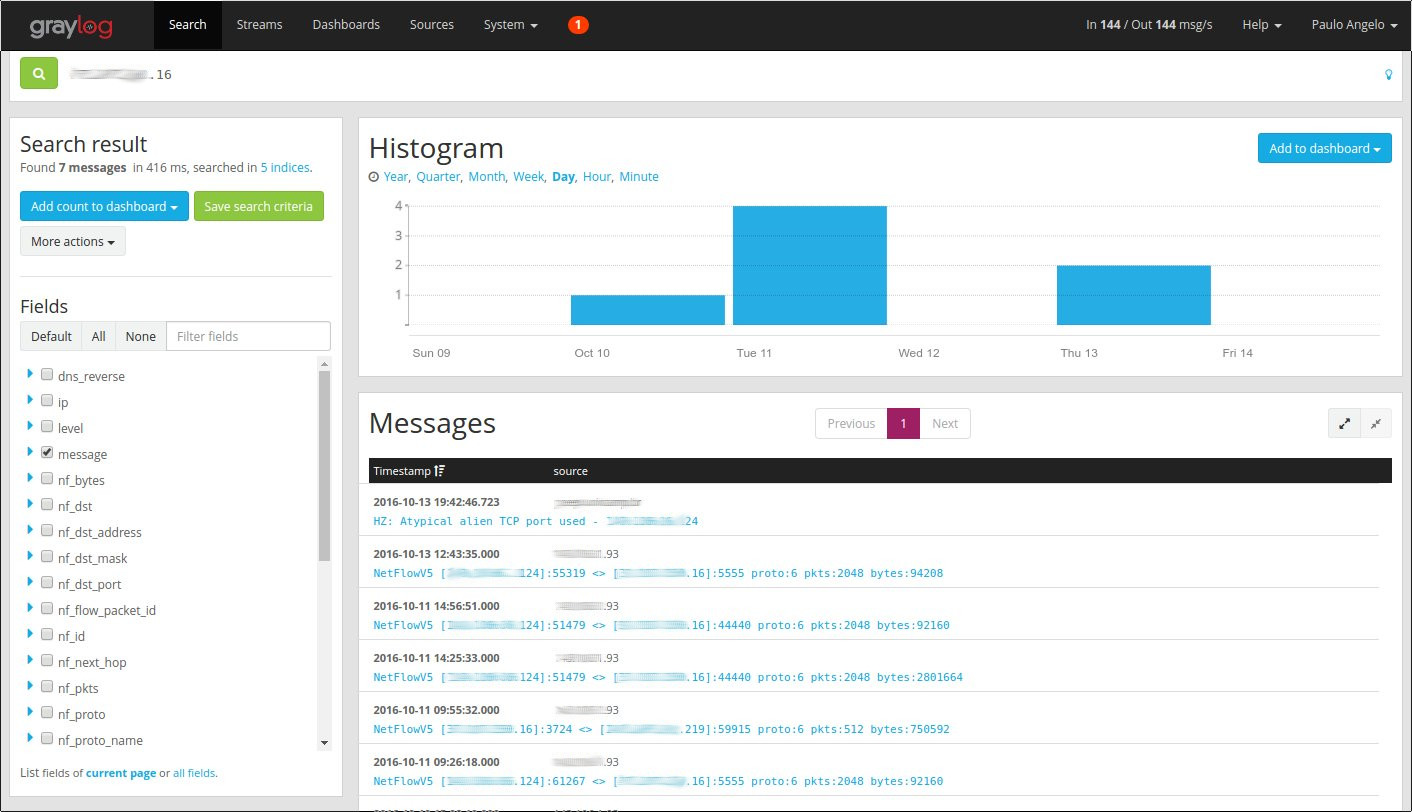
7. Searching an IP
An IP search returns collected sFlows and events regarding the IP. This integration simplifies incident analysis.
